Reading your insights dashboards
Understand the Event, Lead, CRM and Marketing insight views.
Insights dashboards visualize your data with filters for location, date and manager.
- Event Insights — status donut plus F&B sales, contracted value and a payment summary (finance vs operations view).
- Lead Insights — the top-of-funnel equivalent.
- CRM Insights — platform-wide totals (customers, leads, events, reservations).
- Marketing Insights — campaign opens, clicks and the send funnel.
- Open the module’s Insights page, set the date range and filters, and click Submit.
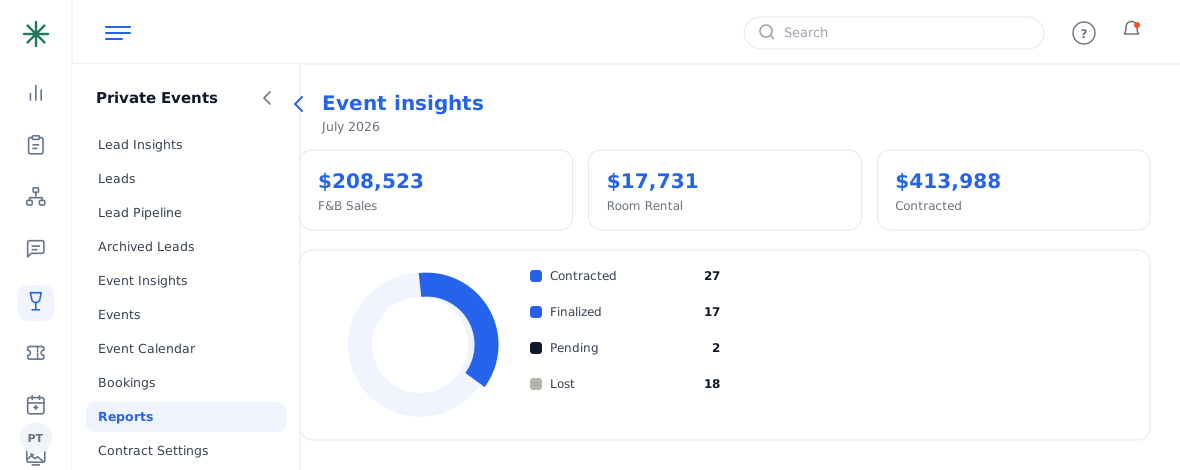
An insights dashboard
Frequently asked questions
What’s the difference between Insights and Reports?
Insights are visual dashboards for a quick read of the current picture; Reports are filterable, exportable tables for detail and finance.
Event Insights has a finance vs operations toggle — which do I use?
Use the payment-date (finance) view for “money collected in this period,” and the event-date (operations) view for “events happening in this period.”
Numbers look off — what should I check?
The date range and filters (location, manager). Insights only reflect what the filters allow.